



Illustrative use case · Cognos & executive reporting

When the board needs one answer: Connect reports around financial numbers everyone can explain

Finance should arrive at the board meeting ready to discuss performance. Explore how a governed reporting workflow could connect Cognos board packs and Power BI dashboards—reducing manual assembly while keeping definitions, review and distribution under control.

Hypothetical enterprise scenario. Figures and targets illustrate the approach; they are not reported client results.

IBM Gold Business PartnerIBM Gold Partner · Finance, data and engineering in one conversation.
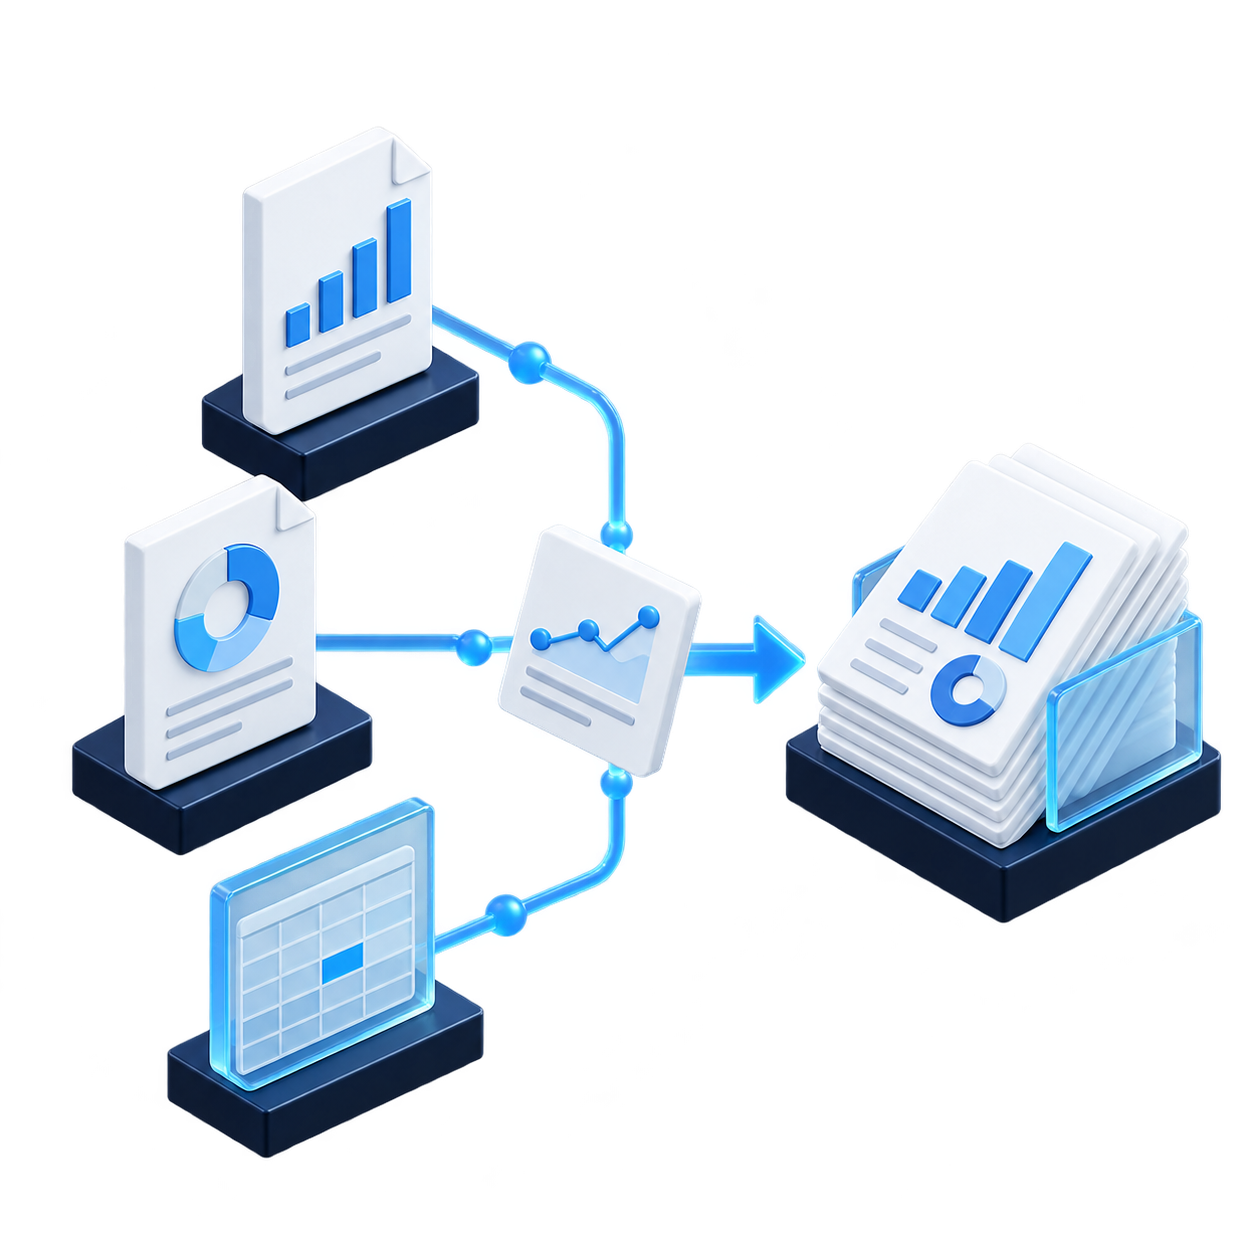
Data sources connected through a validation gateway to executive dashboards and board reports
1
Board pack in scope
3
Priority financial measures
2
Reporting channels
0
Unexplained differences goal
01 / The Business Decision.Start with the work your teams recognize.
01

The meeting starts with a reconciliation instead of a decision

Consider a multinational with established Cognos reporting and departmental Power BI dashboards. A monthly board pack combines revenue, gross margin and headcount across several entities. Finance Systems owns the delivery process, the Controller approves the numbers and the BI team supports the platform. The first scope is one pack—not every report in the estate.

Same measure, different answers

Finance closes revenue by accounting period; a sales dashboard uses invoice date. Both views can be valid, but the difference is invisible to the board.

Agree period cutoffs, currency treatment and adjustments before changing a dashboard.
The pack depends on manual assembly

Analysts export tables, paste charts and check totals across slides and spreadsheets. A late correction means rebuilding several versions.

Separate repeatable report generation from the commentary and judgment Finance must retain.

Nobody knows what can be retired

Duplicated reports and inherited schedules make modernization feel risky. Usage alone does not reveal an annual or regulatory dependency.

Combine usage evidence with owner review and a reversible archive decision.

Correct numbers reach the wrong audience

Entity filters, recipient lists and access rules can diverge between report channels. A successful job does not prove correct delivery.

Test both allowed access and denied access, then verify the recipient-specific output.

Definitions before dashboardsReview before distributionOne pack before estate-wide rollout

The practical question: can we deliver the agreed board view on schedule, trace each number to its source and explain legitimate differences in departmental reporting? Start with the pack that creates the most reconciliation work.

Steven
02 / A Controlled Approach.Connect inputs, checks and accountable decisions.
02

Five steps from conflicting reports to a controlled board pack

For this scenario, Grandview would map the reporting process, agree a financial baseline and automate a bounded release. Consistency means outputs obey the same approved definition and cutoff; it does not mean every dashboard must show an identical business view.

01

Map the pack and its dependencies

Inventory source tables, Cognos packages, Power BI models, schedules, manual adjustments and recipients. Confirm the owner of each output.

Output · Pack inventory & ownership map
02

Agree the metric contract

Specify calculation, entity scope, currency, cutoff and treatment of adjustments for revenue, gross margin and headcount.

Output · Approved definitions & reference period
03

Build the governed reporting path

Choose where shared transformations belong. Configure the two reporting channels against those rules and record their refresh checkpoints.

Output · Source-to-report mapping
04

Validate content and delivery

Compare totals, filters, layout and access using representative roles. Investigate differences and retest corrected outputs.

Output · Exception register & recipient tests
05

Rehearse, release and monitor

Run an agreed close rehearsal, retain an approved fallback pack and switch schedules only after Finance and BI sign off.

Output · Release checklist & operating runbook

Example: why gross margin differs

Illustrative period: revenue $10.0M and cost of sales $6.5M produce gross profit $3.5M and margin 35%. A dashboard using $6.2M of cost reports 38%. The three-percentage-point gap must be traced to the cutoff or adjustment scope; it is not a rounding exception.

Acceptance: both approved board views use the agreed $6.5M cost baseline. A separate operational view can differ if its scope is labelled and reconciled. Record source snapshot, definition version, reviewer and release status.

03 / Connected Architecture.Preserve ownership. Make the flow explainable.
03

Keep the systems. Connect the decision.

A bounded architecture for this scenario. Choose interfaces, refresh cadence and deployment after reviewing the existing environment.

LAYER 01

Preserve approved source records

ERP and consolidation records remain authoritative. Capture the relevant close snapshot and identify the approved adjustment process.

ERP · consolidation · approved adjustments
LAYER 02

Govern definitions and transformations

A shared data layer or coordinated model rules implement the metric contract. Trace changes across Cognos and Power BI rather than assuming automatic semantic equivalence.

Metric ownership · lineage · refresh controls
LAYER 03

Deliver and verify each channel

Cognos produces the agreed formatted reports; Power BI supports exploration. Test recipient-specific distribution and record which data checkpoint each view represents.

Cognos reporting · Power BI · release log
04 / Illustrative Targets.Baseline. Target. Acceptance criteria.
04

Define the improvement. Agree how to measure it.

Illustrative baselines and targets for a bounded pilot. Confirm the starting point and acceptance criteria with your team before delivery.

Pack preparation effort

BaselineTarget

Recover analyst time for explanation

Illustrative baseline: 24 analyst-hours of extraction, assembly and checks per pack. Measure actual touch time separately from waiting.

Illustrative target: 8 analyst-hours for the same pack, including human review. That is about 67% less touch time, subject to pilot validation.

Financial consistency

BaselineTarget

Explain every scoped difference

Baseline: compare the three priority measures across the pack and selected dashboards; record unexplained differences.

Target: no unexplained differences at the agreed close checkpoint. Approved alternative views retain explicit definitions.

Distribution reliability

BaselineTarget

The right output for the right recipient

Baseline: inherited schedules and lists, with delivery confirmation checked manually.

Target: all scoped recipient and negative-access tests pass; missed jobs raise an owned alert. Verify the agreed delivery deadline.

Report estate control

BaselineTarget

Retire only what owners have reviewed

Baseline: duplicate and unowned reports obscure the scope. Annual use and hidden dependencies may not appear in a short telemetry window.

Target: every in-scope report has an owner and retain, improve or archive decision. Measure scope reduction only after review.

Start with one decision, establish the baseline and agree what a useful first release must prove.

Talk to our team →
05 / Decision FAQs.Clear scope. Explicit assumptions. Practical next steps.
05

Questions to settle before the first scope

Practical answers for the business owner, Finance and the team responsible for delivery.

Does this require replacing Cognos with Power BI?

No. This scenario keeps the channels that serve a defined purpose. The assessment may recommend retaining formatted reporting in Cognos and using Power BI for selected analysis, with an explicit approach to shared definitions.

Can Power BI simply reuse a Cognos semantic model?

Do not assume direct interchangeability. Inspect the model and supported interfaces, then decide whether to share prepared data or implement coordinated rules. Validate measures, permissions and refresh behavior in both channels.

Can the whole board pack be automated?

Automate repeatable data preparation and supported report outputs. Narrative commentary, approvals and some slide assembly may need a separate workflow. Agree formats and exception handling before promising end-to-end automation.

How do you protect confidential reports?

Test entity filters and user roles, recipient mappings and denied-access cases. Agree portal or file distribution with the security owner; an exported attachment needs its own handling controls.

How long does the first scope take?

Start by scoping one pack and a small metric set. Delivery depends on model condition, interfaces and the close calendar. Agree access, owner availability, rehearsal periods and acceptance before committing to a schedule.

What happens when a late adjustment arrives?

Version the close snapshot and identify affected outputs. Regenerate, recheck and reapprove the pack; make superseded versions identifiable instead of silently replacing released figures.

What should we bring to the first conversation?

An outline of one board pack, the main sources and the step that consumes the most time. Use a sanitized example initially. Finance and BI can then agree whether a bounded reporting assessment is useful.

06 / Your Next Step.Bring one challenge. Define a useful first scope.
06

BRING YOUR REPORTING CHALLENGE

Tell us which board pack takes too long or where reports disagree. Grandview brings finance and BI expertise to help you define a practical first scope.

Talk to our team
Rochelyn Sy
Rochelyn SyPrincipal Consultant
IBM Gold Business PartnerPlanning, analytics & IBM expertise